
Table of Contents
- Key Takeaways
- Introduction: Guide to Analytics
- A Comparison of ROI and ROAS
- Media Plans & Performance Goals
- What is a Digital Media Plan?
- How to Organize Performance Goals
- Google Analytics – The Gold Standard
- Key Industry Formulas & Benchmarks
- A/B Testing
- Average Order Value (AOV)
- Clicks
- Click Through Rate (CTR)
- Conversion Rate (CVR)
- Cost Per Acquisition (CPA)
- Cost Per Click (CPC)
- Customer Acquisition Cost (CAC)
- Impressions
- Interaction or Engagement Rate (IR)
- Lifetime Value (LTV) or Customer Lifetime Value (CLTV)
- Lifetime Value to Customer Acquisition Cost Ratio
- Return on Ad Spend (ROAS)
- Return on Investment (ROI)
- Current and Future Trends In Analytics
- Additional Resources for Analytics
- Conclusion
Key Takeaways
In this article you will find:
- Key analytical formulas used in digital marketing;
- Easy to follow real-world examples of exactly how to apply them;
- Industry benchmarks that are used for each important analytical metric;
The following specific analytical subjects will also be covered:
- ROI vs. ROAS;
- Creating media plans;
- Setting performance goals;
- Google Analytics (gold standard);
- Incorporating the right types of metrics;
- Testing methods performed and why they are performed;
- Alternative resources to Google Analytics – such as Google Search Console;
Introduction: Guide to Analytics
“Data may disappoint, but it never lies.” – Jay Samit, Former Vice-Chairman of Deloitte Digital.
Digital marketing analytics (when managed appropriately) are the difference between hoping and ensuring a campaign turns out well.
If you have good ways of measuring and attributing credit to various media sources (e.g., display ads, social media ads, and paid search ads), then your performance goals will help you measure success – or provide a roadmap you can follow to make the appropriate adjustments to ensure success.
Regardless of your marketing goals – e.g., raising brand awareness, increasing newsletter subscribers, and improving customer lifetime value – analytics can help guarantee your marketing activities remain on track to achieve your objectives, and maximize your ROI.
A Comparison of ROI and ROAS
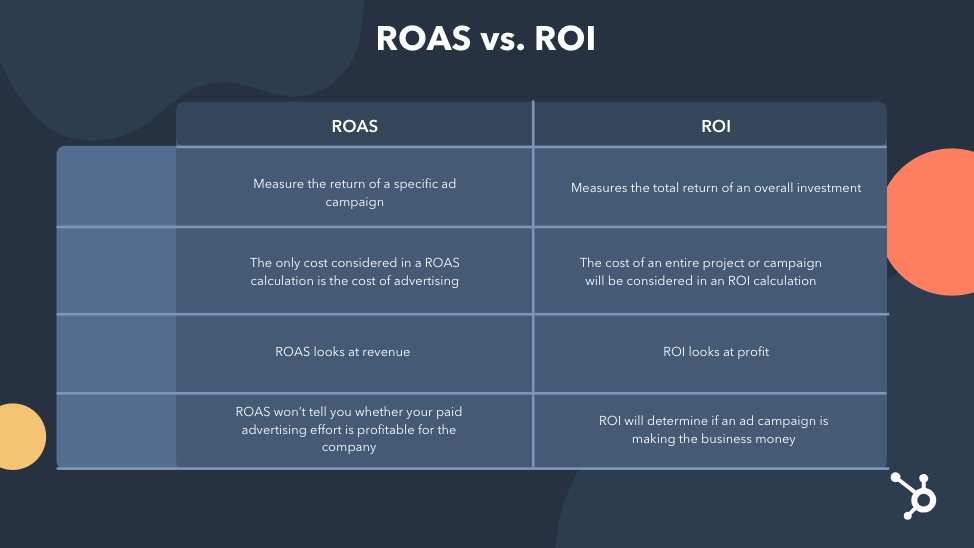
Source: Infographic courtesy of HubSpot.
A company can maximize the ROI and ROAS of any digital marketing campaign by relying upon analytics to measure and monitor their marketing activities.
The actual industry formulas for ROI and ROAS are discussed below.
Media Plans & Performance Goals
Performance goals are sometimes referred to as marketing objectives.
Whatever label you give them, they are a bullseye for you to aim toward that has a numeric value that can be measured.
For example, let’s say you had a marketing objective of raising brand awareness amongst African-American and Latin audiences.
In order to reach that objective, you decide that 20% of this years’ advertising budget will be devoted towards promoting your product or service to a target audience that values diversity, equity and inclusion.
So you create a media plan or campaign of targeted advertising aimed at the appropriate customer persona both online, and during offline events such as the NAACP Image Awards and the Latin Grammy Awards.
Your performance goal in this instance is the 20% increase in your advertising expenditures.
What is a Digital Media Plan?
Media plans in general address where your advertising will appear – such as TV, radio, social media, and search engines, when your advertising will appear, and how often it will be presented.
A typical digital media plan is comprised of the following components:
Target Audience – who you hope to reach with your targeted product or service message based upon a previously created customer persona of your ideal audience.
Budget – the total amount of money your company is going to allocate towards a given digital marketing campaign.
Media Mix – which marketing or advertising channels (e.g., television, newspaper, social media, and e-mail) are going to receive what percentage of the allocated budget.
Campaign Duration – how long will your campaign need to run?
Is this a campaign that is slated to run for the next six months in order to increase brand awareness amongst consumers?
Is this a campaign designed to promote a product or service that is only available during the holiday season or certain times of the year such as during the summer months only?
Is this a campaign for an event that is scheduled to last no more than a long weekend or a single day (e.g., a musical concert, sporting contest or trade show)?
Key Performance Indicators or KPIs – a numeric value used to determine whether or not a company has met its stated Business Goals (e.g., increase profits and gain market share) and its stated Marketing Goals (e.g., grow website traffic and generate new leads).
Note: Marketing goals should always be designed to help or support a company towards achieving their overall business goals.
Performance Goals – These are very specific, campaign-level goals set by a company, such as Return On Ad Spend or ROAS.
ROAS, one of the most common performance goals in a paid advertising campaign, is calculated as follows:
Number of Products Sold x Price Per Unit / Ad Spend = ROAS;
Example: $100 in ad spend, to sell 3 units, of a product that sells for $125;
3 x 125 / 100 = 3.75 ROAS;
This campaign would have generated $3.75 for every $1.00 spent on advertising;
If you had an overall marketing goal of a 6:1 ROAS, you might divide this up between each media channel, and create campaign-level performance goals such as…
Social Media Ads – 4:1 ROAS;
Search Engine Ads – 3:1 ROAS;
Display Ads – 2:1 ROAS;
How to Organize Performance Goals
Goal setting templates are a very useful tool for tracking performance goals and associated metrics.
The following is a Sample Media Planning Template that can be created using MS Word, MS Excel or Google Sheets, and would serve as an effective format for organizing your performance goals as they relate to any digital marketing campaign.
This particular exemplar happens to relate to a paid advertising campaign:
| Marketing Goals | Budget | Duration | Audience | Media Source | Media Mix | KPIs | End Goals |
|---|---|---|---|---|---|---|---|
| Awareness Stage of the Marketing Funnel: Increase overall brand awareness by general target audiences | $45,000 | 3 months | Adults: 40-60 years old | Display Ads (e.g., Google Partner Sites) | 50% | CTR (Click Through Rate) | 7% increase in page views; CTR > 3% |
| All adults | Search Ads (e.g., Google & Bing) | 30% | CTR (Click Through Rate) | 12% increase in page views; CTR > 3% | |||
| Adults: 18-39 years old | Social Media Ads (e.g., Instagram & YouTube) | 20% | Audience growth rate (e.g., Views, Followers & Subscribers) | 15% or greater audience growth rate |
Sample Media Planning Template
Google Analytics – The Gold Standard
Google Analytics has been the gold standard for analytical platforms for many years.
Google Analytics can be used to evaluate the performance of a website, a blog, a mobile application, an e-commerce store, an advertising campaign, or any web page that is associated with a unique measurement ID to enable the collection of metrics.
These are all referred to as “properties” by Google – an analytics account may contain a single property or multiple properties.
There are certainly other, very competent, analytical platforms offered by a variety of SaaS companies on the market.
Which one you ultimately decide to utilize to measure your digital marketing will be up to your business preferences.
I will list a few of those alternative platforms later in this post, but for now I want to focus on Google’s product.
If you have a Google Account, then you can access the live Google demo account, which contains data from the Google Merchandise Store and a gaming app in Google Play called “Flood-It!”
This is where you can practice and gain hands-on experience with this analytical platform. The Google Analytics demo account features these functions:
- A fully functional Google Analytics account;
- A way for you to look at real-time business data;
- A way for you to experiment with Google Analytics features;
- One Universal Analytics property and two Google Analytics 4 properties;
If you are ready to get started using Google Analytics on an actual property that you currently own and maintain, they have a very comprehensive sign-up page where you can get started setting up your analytics account(s).
Google Analytics is 100% free to register your account, add properties, and track relevant performance metrics – an existing Google account is the only requirement.
Special Note: Google is currently in the process of transitioning from their Universal Analytics platform (UA), to the more diverse Google Analytics 4 platform (GA4).
They are expected to sunset UA by July 1, 2023, with no more data or “hits” being processed through the platform, on or after that date. You should be preparing to transfer any existing UA properties to the GA4 platform as soon as feasible.
There are a variety of resources available for you to access which will enhance your working knowledge of Google Analytics.
Two of the best free sources of training material can be found here:
- Analytics Help is Google’s support website for analytics.
- Skillshop is a self-paced training platform offered by Google.

Key Industry Formulas & Benchmarks
Understanding commonly used formulas, methods and benchmarks for measuring key marketing metrics is an important aspect of developing your knowledge, skills and abilities in the digital marketing world.
Whether you are a client seeking to hire the services of a professional marketer, or someone wishing to provide professional grade marketing services, the following industry-wide formulas and methodologies may be used by a company during any given digital marketing campaign:
(Note: This list represents commonly employed methods for calculating key metrics, is organized in alphabetical order, and includes industry benchmarks!)
A/B Testing
Also referred to as “Bucket Testing” or “Split Testing”. This is a method which tests two versions of the same, for example, website landing page or e-mail communication.
There is usually a single differing variable such as a call-to-action or CTA on a website landing page, or a modified subject line in the case of an e-mail communication.
These would be split 50/50 amongst the visitors or recipients to see which version performs the best.
Average Order Value (AOV)
Calculated as the total sum of a customer’s individual order amounts, divided by the total number of orders placed by that customer
Formula: Revenue / Number of Orders = AOV
Example: $1,500 / 11 = $136.36 AOV
Clicks
The total number of clicks, for example, on a search engine advertisement during a paid campaign, or the total number of clicks on an organic search engine listing displayed on a Search Engine Results Page (SERP).
Click Through Rate (CTR)
The number of clicks on a search ad or organic search listing or e-mail offering, divided by the number of impressions, times 100
Formula: Number of Clicks / Number of Impressions x 100 = CTR
Example: 500 / 8,500 x 100 = 5.8% CTR
Industry Benchmark: 6% to 7%
Conversion Rate (CVR)
A conversion happens when a potential customer takes a desired action such as downloading an e-publication, subscribing to a newsletter, registering for a webinar, submitting a contact form, or signing up for a loyalty rewards program.
Formula: Number of Conversions / Number of Interactions x 100 = Conversion Rate
Example: 750 / 16,000 x 100 = 4.6% Conversion Rate
Industry Benchmark: 3% to 5%
Cost Per Acquisition (CPA)
This represents the average cost incurred to acquire a potential new customer.
Cost Per Click (CPC)
This is the amount a company pays when someone clicks on one of their advertisements, as part of a PPC or pay-per-click digital marketing campaign.
Formula: Total Ad Costs / Number of Clicks = Cost Per Click
Example: $2,400 / 4,800 = .50 or 50 cents per click
Industry Benchmark: Google Display Network is under $1; Google Search Network is between $2 and $4
Customer Acquisition Cost (CAC)
The amount of advertising dollars spent to acquire a new customer – may be calculated individually or collectively.
Impressions
Reflects the total number of times a prospective customer was exposed to an ad, for example, in a search campaign.
Even if the customer didn’t actually see the ad, an impression would normally be counted as long as the customer scrolled the advertisement into view on the SERP.
Interaction or Engagement Rate (IR)
This is a percentage of clicks, swipes, calls, direction requests, and any other interactions by an individual with images, text, extensions, etc.
Formula: Number of Interactions / Reach Per Post x 100 = IR
Example: 575 / 11,750 x 100 = 4.9% IR
Industry Benchmark: 3% to 5%
Lifetime Value (LTV) or Customer Lifetime Value (CLTV)
The average amount of revenue generated by customers over a specified period of time. May be calculated individually or collectively.
Lifetime Value to Customer Acquisition Cost Ratio
Measures the amount of money you earn versus what you spend to acquire the customer.
Formula: LTV / CAC = LTV to CAC Ratio
Example: $7,750 / $2,000 = 3.8:1 LTV to CAC Ratio
Industry Benchmark: 3:1 or higher
Return on Ad Spend (ROAS)
One of the most important KPIs or metrics in paid digital advertising.
Formula: Number of Products Sold x Price Per Unit / Ad Spend = ROAS
Example: 4 x $99 / $100 = 3.9:1 ROAS
Industry Benchmark: 4:1 or higher
Return on Investment (ROI)
This is simply the measure of a marketing campaign’s profitability.
Note: An ROI of 1:1 would be considered the break-even point.
Formula No. 1…
Formula: (Net Sales Revenue – Marketing Cost) / Marketing Cost = ROI
Example: ($375,000 – $75,000) / $75,000 = 4:1 ROI
Industry Benchmark: 5:1 or higher
Formula No. 2…
Formula: [((Number of Leads x Lead-to-Customer Rate x Average Sales Price) – Cost or Ad Spend) / Cost or Ad Spend] x 100 = ROI
Example: [((10 x .50 x $2,500) – $1,600) ÷ $1,600] x 100 = 681% ROI
Industry Benchmark: 500% or higher
Real-World Example of ROI
A medical practice group that focuses on orthopedic medicine and physical therapy services wants to gain more patients.
They post 8 blog articles about the prevention and treatment of sports injuries, and share them on social media.
Each post includes a unique URL that links to a specific landing page where a prospect can complete a short contact or intake form to set up an in-office consultation.
The medical group spends $1,600 paying a digital marketing professional to draft 8 blog posts and share them across various social platforms: Facebook; Instagram; LinkedIn and TikTok.
The blog and socially shared posts result in 10 leads, of which 5 become patients. The medical group makes an average of $2,500 per patient.
Using our Formula No. 2 from above…[((10 x .50 x $2,500) – $1,600) ÷ $1,600] x 100 = 681% ROI
Note: The medical group may choose to stay with this strategy, or, if they want to increase the ROI %, they might try creating an engaging video of their sports injury services.
They may also try posting their original content more frequently, to determine if that increases the total number of leads.
Current and Future Trends In Analytics
There are several trends developing that relate to analytics.
The term Big Data refers to the practice of systematically mining and extracting information from large datasets.
Big data can be used for risk analysis, to optimize supply chains, make marketing decisions, etc.
Marketing professionals are now incorporating big data in the following ways…
- Real-Time Analytics – to monitor data as it happens, in real time, so they can respond to events more quickly. Marketers will be able to adjust a marketing campaign as quickly as the data becomes available.
- Predictive Analytics – to use historical data as a method of predicting what might happen. Predictive analytics can also be used in place of performing an A/B test – saving both time and money.
- Autonomous Marketing – real-time analytics can be used to automate marketing activities. This might be used to automatically modify a social media post or the headline in a search ad based upon how they are performing.
- Artificial Intelligence, or AI – this area is evolving rapidly, and is designed to simulate human thought. We are all now probably well aware of the latest AI programs to hit the consumer marketplace:
- ChatGPT (by OpenAI);
- Gemini (by Google);
- Perplexity AI (by Perplexity AI);
Additional Resources for Analytics
I mentioned above that I would provide some additional resources for alternative platforms aside from Google Analytics, that could be used to perform analytical functions.
Here is a short compilation of some of those platforms available on the market:
Google Search Console
Google Search Console is an analytical tool that actually complements Google Analytics, and helps measure the traffic and performance of your site(s).
It is available through your Google account, and is 100% free to use. Give Search Console a test drive today:
Marketing Suites with Analytics
Marketing software suites that offer analytics features include:
Open Source Tools
Open source tools for marketing analytics include:
Conclusion
Do you utilize marketing analytics on a regular basis?
Have any of the formulas above helped inform your marketing decisions?
What is your favorite metric(s) to track?
Feel free to leave a comment below.
If you have not already done so, please don’t forget to Subscribe in order to receive periodic updates on valuable digital marketing strategies delivered right to your e-mail inbox!
See you in the next blog post…
